Constant price estimates use the prices at a certain point in time (base year) to calculate and compare the volume of production of an economy over consecutive years. Two agricultural products, choy sum and cucumber, are used below to illustrate the calculation of constant price estimates.
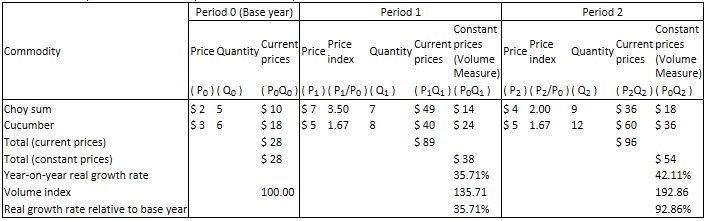
2.Value of production at constant prices Constant price estimates use the prices at a certain point in time (base year) to calculate value of production over several years to remove the effect of changes in prices. The value calculated is known as volume measure, illustrated as follows:ΣP0Qn where 0is the base year, nis the current year, P is the price of the commodity, Q is the quantity produced. The formula represents constant price estimate of the value of production of agricultural products in the current year, which equals the sum of the multiplication of the quantity produced and respective price in the base year of choy sum and cucumber. Table 1 shows that as prices in the base year are used, constant price estimate in the base year is equal to current price estimate, i.e. $28, whereas constant price estimates in Period 1 and 2 are $38 and $54 respectively. 3.Real growth Constant price estimates (volume measures) of different periods are calculated by the abovementioned formula, where real growth is the comparison of volume measures, illustrated as follows:
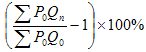
Applying the formula, real growth of Period 1 and 2 are 35.71%, i.e.【(38÷28)-1】×100% and 42.11% respectively.
On the other hand, real growth can be expressed as the change in the volume index of the value of production in different periods, where volume index is illustrated as follows:

where Ip is the price index of the current year, which equals the price in the current year divided by the price in the base year.
Assume Period 0 is the base year, sum up the quotients of the value of production of each agricultural product at current price by its respective price index, divide by the value of production in the base year, and multiply by 100. As illustrated in Table 1, as current price is used in the base year, volume index of the base year is 100, whereas volume indices of Period 1 and 2 are 135.71 and 192.86 respectively. To calculate the real growth (economic growth), simply divide the volume indices of the years concerned, minus 1, and then multiply by 100%. In comparison with Period 0, the real growth of Period 1 and 2 are 35.71% and 92.86% respectively. In comparison with Period 1, the real growth of Period 2 is 42.11%.